
Australia is no stranger to the impacts of natural disasters. These catastrophes not only have lasting effects on communities, but on insurance. Read on to find out about five of the costliest disasters and how they changed insurance cover.
Bushfires, heatwaves, droughts, floods, severe storms, hailstorms, tropical cyclones, earthquakes, tsunamis and landslides – Australia has experienced them all. The frequency and severity of natural disasters has been increasing, and it has taken a heavy toll on affected communities. It is also challenging the availability and affordability of insurance across the nation, but especially so in disaster-prone areas.
In the 30 years to 2017, natural disasters or extreme weather events directly impacted more than nine million Australians. Since 2017, more natural disasters have struck, including the costliest floods in Australian history and the Black Summer bushfires, touching the lives of millions more.
According to Deloitte, natural disasters currently cost the Australian economy more than $38 billion a year and this figure is expected to grow to at least $73 billion a year by 2060.
All natural disasters leave devastation and loss in their wake. Here are five of the costliest natural disasters to date and how they influenced insurance:
Costliest hailstorm – Syndey 1999
Event: It was early evening on 14 April 1999 when a severe hailstorm swept north across Sydney’s inner and eastern suburbs. Over five hours, 85 suburbs were pelted with hailstones the size of cricket balls, some travelling at more than 200 kilometres an hour.
Damage: The hailstorm caused damage to 24,000 houses including windows, roofs and skylights, while 70,000 cars sustained windscreen and panel damage.
Losses: More than $1.7 billion in insured losses were recorded. In 2023 dollars, the catastrophe would have an estimated loss value of $8.85 billion.
Impact on insurance: Analysis of this hailstorm led to the conclusion that the event was not a “once-in-a-lifetime” event from a hazard perspective. Consequently, risk modelling was refined, with Moody’s RMS finding that Sydney would experience hail losses of around $1.5 billion (in 2019 dollars) every decade or two. Risk modelling is a tool used by insurers to help quantify risk and price insurance. With better data and modelling, the cost of insurance premiums can be adjusted to better reflect the risk posed in hail-prone areas.
Costliest bushfire – 2019-20 Black Summer
Event: Between September 2019 and March 2020, devastating bushfires swept from coast to coast. Fires raged in NSW, Victoria, Queensland, SA and WA. It was estimated that around 80 per cent of the nation’s population was impacted by smoke from the bushfires at some point.
Damage: The bushfires decimated an estimated 24.3 million hectares, destroyed more than 3,000 buildings (including 2,779 homes), and killed 33 people directly (another 450 more lost their lives from the effects of smoke inhalation). Billions of wildlife were also killed.
Losses: Treasury estimates that the total economic impact of the Black Summer bushfires was a $4.6 billion reduction in GDP, while the Insurance Council of Australia (ICA) says the total insured damage from this catastrophic event totalled $2.32 billion (though other sources suggest it could be as high as $5.5 billion), with close to 39,000 claims lodged.
Impact on insurance: The bushfires resulted in almost 40,000 claims and, according to the ICA, many were underinsured. Several major insurers have since invested in bushfire mapping tools and ways to better understand and price bushfire risk. Researchers at the University of NSW have noted that the increasing frequency and severity of bushfires could mean insurers in Australia follow the lead of those in other countries, withdrawing from providing insurance in specific areas where risks are too high.
Costliest tropical cyclone – Tracy 1974
Event: Cyclone Tracy swept through Darwin in the early hours of Christmas Day 1974. Wind gusts reached 217 kilometres per hour (before the anemometer was destroyed), there was a storm surge of 1.6 metres in Darwin’s harbour, and 255 millimetres of rain fell in 12 hours overnight.
Damage: Seventy-one people lost their lives and 80 per cent of the city was devastated. Some 10,000 homes were destroyed and about 70 per cent of houses suffered serious structural failure.
Losses: The insured losses were put at $200 million. In today’s money, the cyclone would have resulted in an estimated $7.4 billion in losses.
Impact on insurance: The cyclonic winds produced by Cyclone Tracy were stronger and longer than anyone thought possible – resulting in 60 per cent of houses being damaged beyond economic repair. As a result, the Commonwealth Government commissioned scientists to develop more rigorous building codes to enable buildings to better withstand cyclones. Cyclone mitigation is now required under the building code. Despite cyclone mitigation measures being required for decades, losses from cyclones in northern Australia continued to mount. The costs became so high that very few insurers were willing to take on the risk, making obtaining cover for properties in cyclone-prone areas difficult and the costs, when cover was available, often prohibitive. This issue is being addressed with the Northern Australia Cyclone Reinsurance Pool initiative, which is increasing the availability of cover, and also reducing premium costs.
Costliest earthquake – Newcastle 1989
Event: It was around morning tea on 28 December 1989, when Newcastle was devastated by a 5.6-magnitude earthquake. The epicentre was approximately 15 kilometres south-west of the Newcastle CBD (near Boolaroo).
Damage: The quake claimed 13 lives and 160 people were hospitalised. Damage to buildings and facilities occurred within a 9,000 square kilometre region. Around 50,000 buildings were damaged, approximately 40,000 of which were homes. Around 300 buildings were demolished by the quake. In total, some 300,000 people were affected and 1,000 were made homeless.
Losses: The original damage bill came in at $862 million. In 2023 dollar terms, the earthquake would have incurred $6.54 billion in insured losses.
Impact on insurance: When the Newcastle earthquake occurred, catastrophe loss modelling for the insurance industry was in its infancy. Spurred by the quake, and enabled by the sponsorship of the insurance industry, Risk Frontiers was founded in 1994, estimating catastrophic losses from natural disasters. With this data, insurers can better understand the risk, better design policy coverage, and better price premiums.
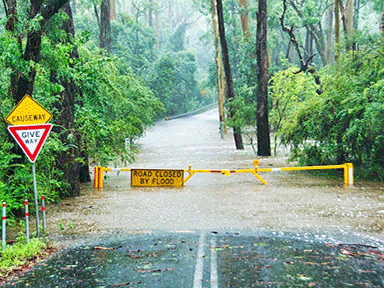
Costliest flood – South East Queensland and coastal NSW Feb/March 2022
Event: Between 23 February and 7 April, South-East Queensland, Wide Bay–Burnett, and parts of coastal New South Wales suffered catastrophic floods. By the end of the first week in March, southern Queensland and parts of New South Wales had each received more than a year’s worth of rainfall. Images of swirling floodwaters and the devastation that followed captured worldwide attention.
Damage: The floods have been recognised as one of the most devastating in the nation's history. Damage was caused to tens of thousands of homes, infrastructure and vehicles.
Losses: With more than 246,000 claims lodged, most for damage to homes, the bill for these floods has topped $6.37 billion.
Impact on insurance: According to the ICA, flood events accounted for more than 54 per cent of losses from declared insurance events in the last five years. In 2022 alone, more than 300,000 claims totalling more than $7.4 billion in losses were made. Considering the frequency and severity of claims (which are predicted to increase in the years ahead), the insurance industry has had to reassess providing flood cover for high-risk properties. Different insurers have responded differently, with some limiting cover or not offering flood cover as standard (only available as an add-on), others increasing premiums, and others still no longer offering flood cover at all.
As the costs mount…
It is probably fair to say that natural disasters occur with a rather disconcerting regularity in Australia. While all are devastating, those which are extreme become imprinted on our collective consciousness. In insurance-land, some catastrophes are also indelibly inked in the memory and on the balance sheets due to the extreme losses incurred. In a time when these events are increasing in frequency and severity, the impact of extreme weather events continues to be reflected in the availability and affordability of insurance cover – but the insurance industry is working with governments, agencies and organisations to find ways to help ensure cover will still be available for those who need it in the years ahead.
If you have questions about cover for natural disasters in any EBM RentCover landlord insurance policy, please ask a member of our friendly Expert Care team – 1800 661 662.
*While we have taken care to ensure the information above is true and correct at the time of publication, changes in circumstances and legislation after the displayed date may impact the accuracy of this article. If you need us we are here, contact 1800 661 662 if you have any questions.
You may also like
View all
Knowing how to respond in times of disaster makes the claims process easier and helps to minimise financial and emotional stress...
Flood events are a seasonal reality and will continue in the future. What does this mean for insurance?
If your property, or one you manage, is damaged due to a natural disaster, these FAQs may help you to navigate this time...